Ellipsometry Data Analysis
Ellipsometry measures changes in light polarization to determine the sample material’s properties of interest, such as film thickness and optical constants. In the case of a bulk material, the equations derived for a single reflection can be directly inverted to provide the “pseudo” optical constants from the ellipsometry measurement, ρ:


This equation assumes there are no surface layers of any type. However, in any bulk material, there is typically a surface oxide or roughness, and the direct inversion would include these as part of the bulk optical constants. The more common procedure used to deduce material properties from ellipsometry measurements follows the flow chart in Figure 10. Regression analysis is required because an exact equation cannot be written. Often the answer is over-determined with hundreds of experimental data points for a few unknowns. Regression analysis allows all of the measured data to be included when determining the solution.
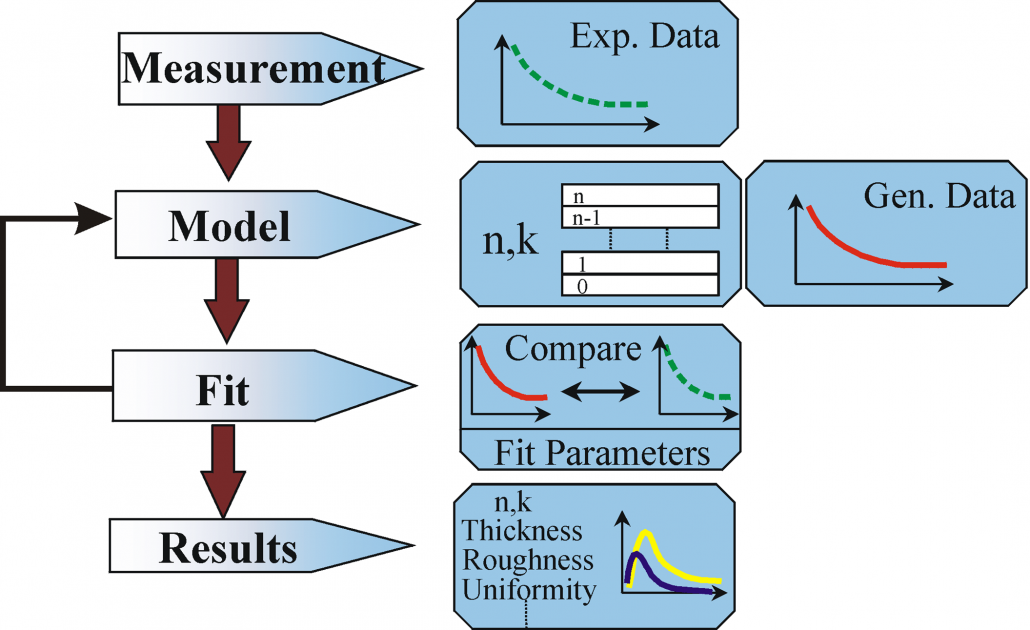
Flow chart for ellipsometry data analysis.
Data analysis proceeds as follows: After a sample is measured, a model is constructed to describe the sample. The model is used to calculate the predicted response from Fresnel’s equations which describe each material with thickness and optical constants. If these values are not known, an estimate is given for the purpose of the preliminary calculation. The calculated values are compared to experimental data. Any unknown material properties can then be varied to improve the match between experiment and calculation. The number of unknown properties should not exceed the amount of information contained in the experimental data. For example, a single-wavelength ellipsometer produces two data points (Ψ,Δ) which allows a maximum of two material properties to be determined. Finding the best match between the model and the experiment is typically achieved through regression. An estimator, like the Mean Squared Error (MSE), is used to quantify the difference between curves. The unknown parameters are allowed to vary until the minimum MSE is reached.
The best answer corresponds to the lowest MSE. For example, the figure below shows the MSE curve versus film thickness for a transparent film on silicon. There are multiple “local” minima, but the lowest MSE value occurs at a thickness = 749 nm. This corresponds to the correct film thickness. It is possible that the regression algorithm will mistakenly fall into a “local” minima depending on the starting thickness and the MSE structural conditions. Comparing the results by eye for the lowest MSE and a local minima allows you to distinguish the true global minimum easily.
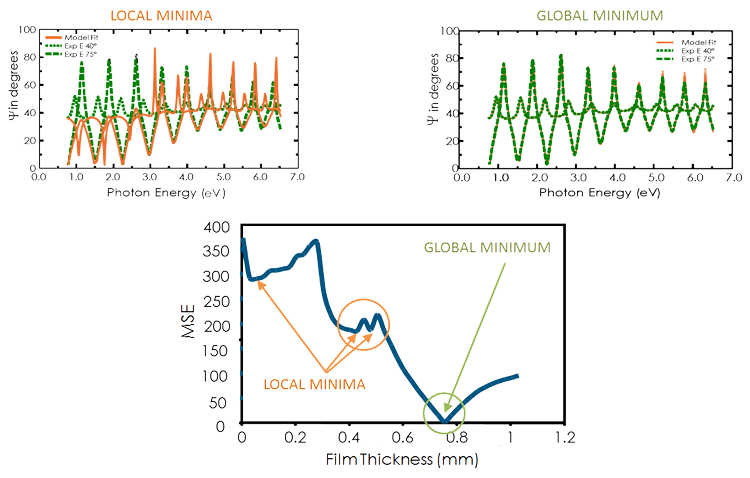
Figure (bottom) MSE curve versus thickness shows the ‘global’ minimum. ‘Local’ minima may be found by the regression algorithm, but do not give the final result. Figure (top-right) The experimental data and corresponding curves generated for the model at the ‘global’ minimum. Figure (top-left) Similar curve at the ‘local’ minimum near 0.45 microns thickness is easily distinguishable as an incorrect result.